In this post, We will tell you about gantt chart and our Excel gantt chart template (Free download) which an automate your tasks. A Gantt chart is a tool for project management developed originally by Henry Gantt in the early 1900s. It is a type of bar chart that shows the start and end times for each task in a project schedule.
The tasks are usually categorized using a work breakdown structure with summary tasks for the main project deliverables and sub-tasks that break the project down into a detailed and manageable task hierarchy.
If you use Excel or Google Sheets, you can create this type of project schedule with almost no learning curve by downloading Exsheets free Gantt Chart Template.
Gantt Chart Template Excel – Free
This template contains the core functionality needed to create a simple Gantt chart easily. Each row of the worksheet represents a separate task. All you need to do is define the start date and duration of each task.
- To add more tasks, you just copy and paste rows (or insert a row then press Ctrl+D to copy formulas down).
- To change the range of dates displayed in the chart area, just slide the scroll bar.
- To track the status of a task, edit the % Complete column. The bars in the chart show the % complete for each task.
- The vertical red line shows the current date.
- To use the automatic work breakdown structure numbering, copy the formula for the appropriate level from the bottom of the worksheet.
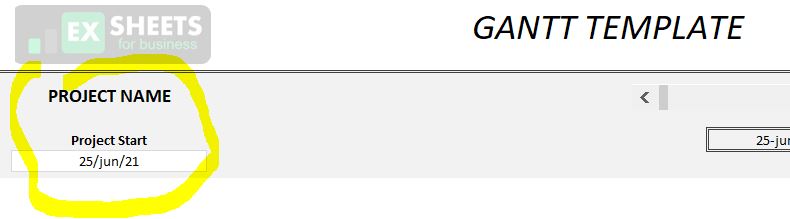
While planning a project, you may also want to use a yearly calendar or project budget worksheet. You can add project name and project start date as shown in image below:
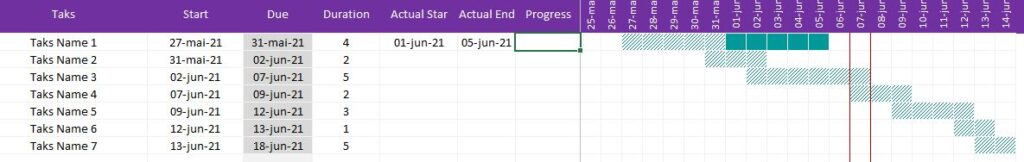
You can add number of tasks in task column and their starting and ending date.According to it chart will be displayed.Duration column will display number of days between start and end date.
These free invoice templates are compatible with versions of Excel 2003, Excel 2007, Excel 2010 and Excel 2013.
Please share the gant chart.
The download is avaiable on this page. Scroll down until to find “Download”. Click and done!