Description
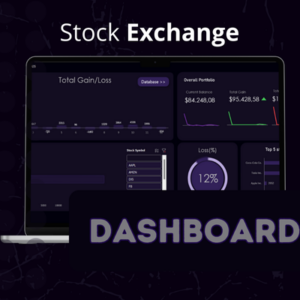
Introduction: In today’s fast-paced business environment, having an efficient and comprehensive dashboard is crucial for monitoring and managing key metrics. Our “Dashboard Saving in Excel” is designed to provide you with valuable insights into various aspects of your operations, consequently helping you to optimize costs and improve overall performance.
Key Features of the Dashboard:
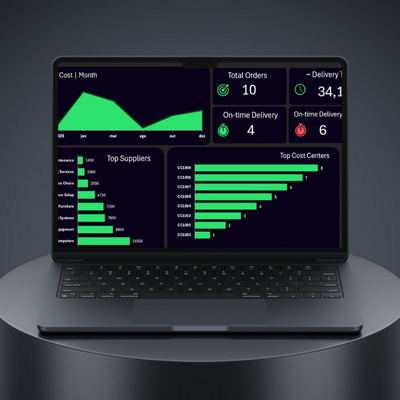
Total Cost | Month: This graph allows you to track your monthly expenses, thereby providing a clear overview of how your costs fluctuate over time. By analyzing this data, you can identify patterns and areas where you can reduce expenses.
Top Suppliers: The “Top Suppliers” graph highlights your main suppliers, thus enabling you to see who you rely on the most. This information can help you negotiate better deals and ensure a steady supply chain.
Top Cost Centers: Understanding where most of your costs are coming from is essential. The “Top Cost Centers” graph breaks down your expenses by department or project, thereby allowing you to target high-cost areas for savings.
Total Orders: Keep track of the number of orders over a specified period with the “Total Orders” graph. This helps in understanding your business’s demand and adjusting your inventory accordingly.
And more:
On-Time Delivery: Ensuring timely delivery is crucial for customer satisfaction. The “On-Time Delivery” graph shows the percentage of orders delivered on time, thus helping you to maintain high service standards.
Delivery Time Average: The “Delivery Time Average” graph provides insights into the average time taken for deliveries. By analyzing this data, you can work on reducing delivery times and improving efficiency.
On-Time Delivery Late: This graph shows the percentage of late deliveries, thereby allowing you to identify and address issues that cause delays.
Saving: Track your savings over time with the “Saving” graph. This helps you to see the impact of cost-saving measures and make informed decisions.
Total Saving Month: The “Total Saving Month” graph gives a monthly overview of your savings, thus enabling you to monitor your progress and set new saving goals.
Settings:
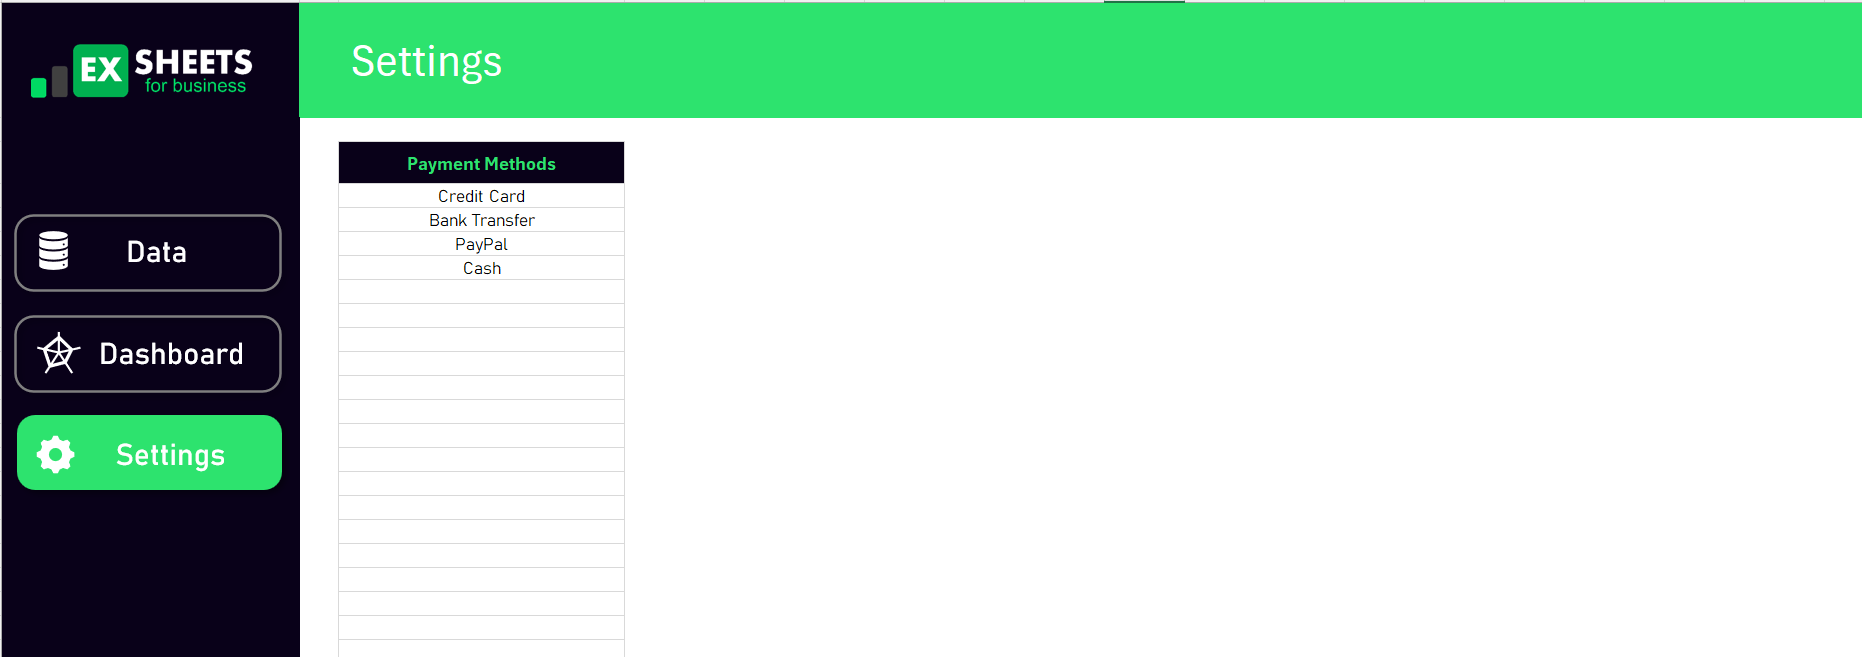
Payment Methods: Customize your payment methods to streamline transactions and ensure smooth financial operations. This setting allows you to manage multiple payment options and choose the most convenient one for your business.
Data Points Included in the Dashboard:
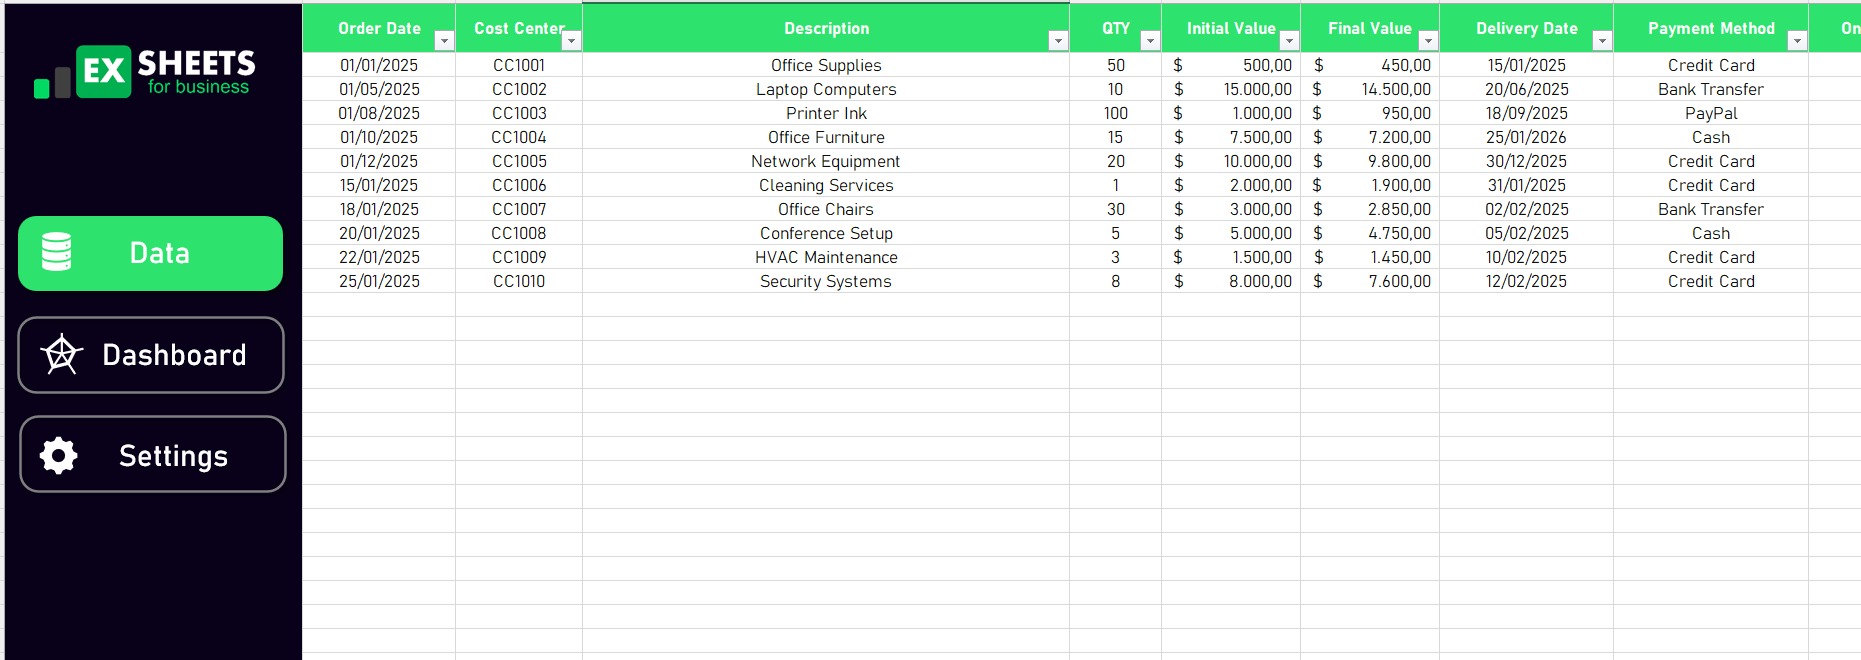
- Order Date: Keep track of when orders were placed to analyze order trends.
- Cost Center: Monitor expenses by specific departments or projects.
- Description: Detailed description of each order for better understanding.
- QTY: Quantity of items ordered.
- Initial Value: The initial cost of the orders.
- Final Value: The final cost after any adjustments or savings.
- Delivery Date: The date when the orders are expected to be delivered.
- Payment Method: Different payment methods used for transactions.
- On-Time Delivery?: Indicator of whether the delivery was on time.
- Status: The current status of the orders.
- Observation: Any additional notes or observations about the order.
Conclusion:
Conclusion: The “Dashboard Saving in Excel” is a powerful tool designed to help businesses monitor key metrics, identify cost-saving opportunities, and improve overall efficiency. By leveraging the insights provided by this dashboard, you can make data-driven decisions that enhance your business’s performance and profitability.



Reviews
There are no reviews yet.