
Description
Introduction
Effectively managing financial cash flow plays a crucial role in the success of businesses, regardless of their size. By maintaining a well-structured cash flow analysis, companies can actively monitor incoming and outgoing funds, ensuring they remain financially stable and liquid. Excel offers a powerful platform for conducting this type of analysis, thanks to its advanced formulas, dynamic charts, and automation features. In this article, we will walk through how to efficiently perform a financial cash flow analysis using a professional, paid spreadsheet that guarantees accuracy and effectiveness.
Why Use a Paid Excel Spreadsheet for Financial Cash Flow Analysis in Excel?
While free templates are available, investing in a paid spreadsheet brings several valuable benefits. First and foremost, it streamlines operations by minimizing manual data entry and significantly reducing errors. Additionally, it incorporates advanced financial modeling that uses dynamic formulas and predictive analytics, making forecasting more reliable. Furthermore, it enhances user experience with interactive dashboards that visually present insights through engaging charts and graphs. Lastly, access to professional support ensures that any troubleshooting or customization needs are addressed promptly.
Key Features of the Paid Spreadsheet
Pre-Built Automation
- Eliminates the hassle of repetitive manual data entry.
- Improves accuracy by reducing the likelihood of human error.
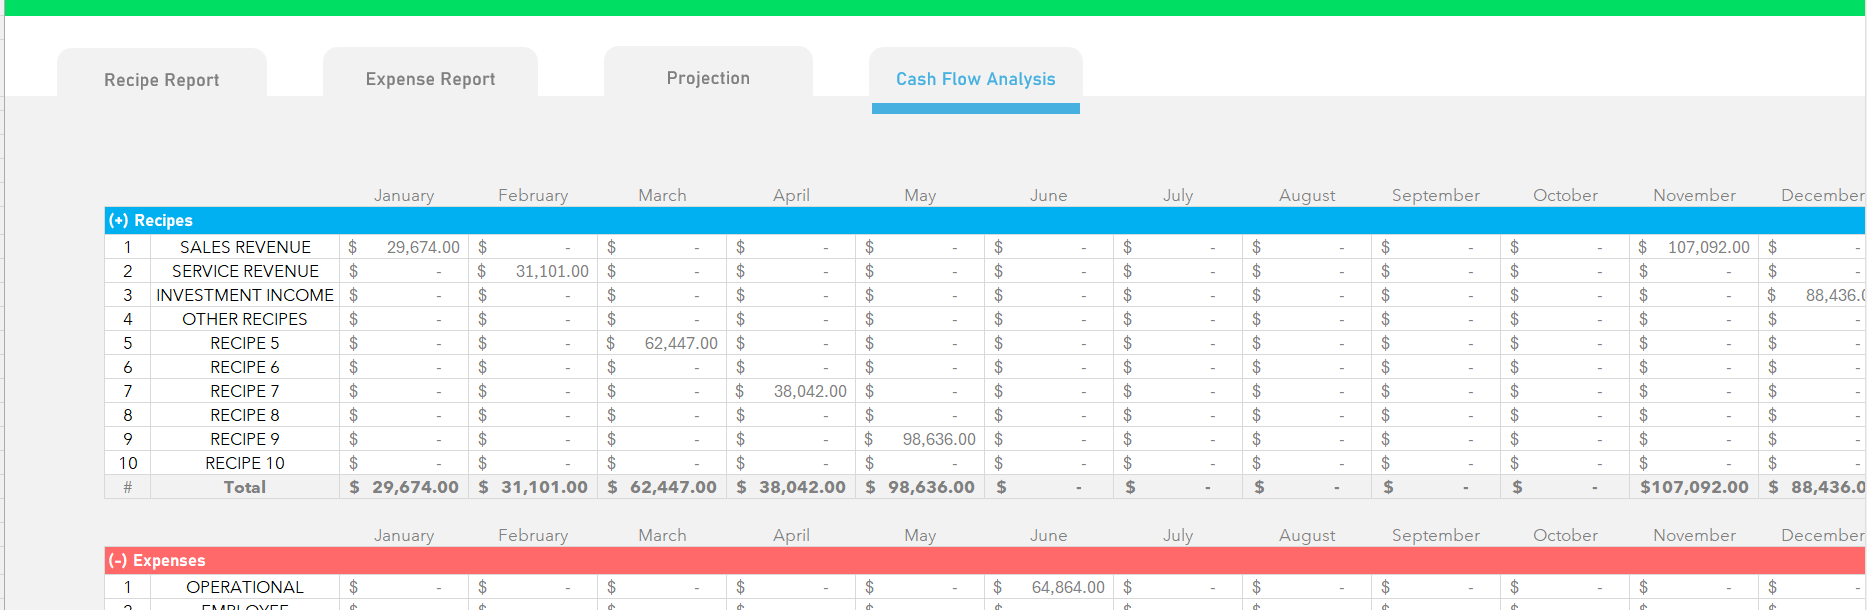
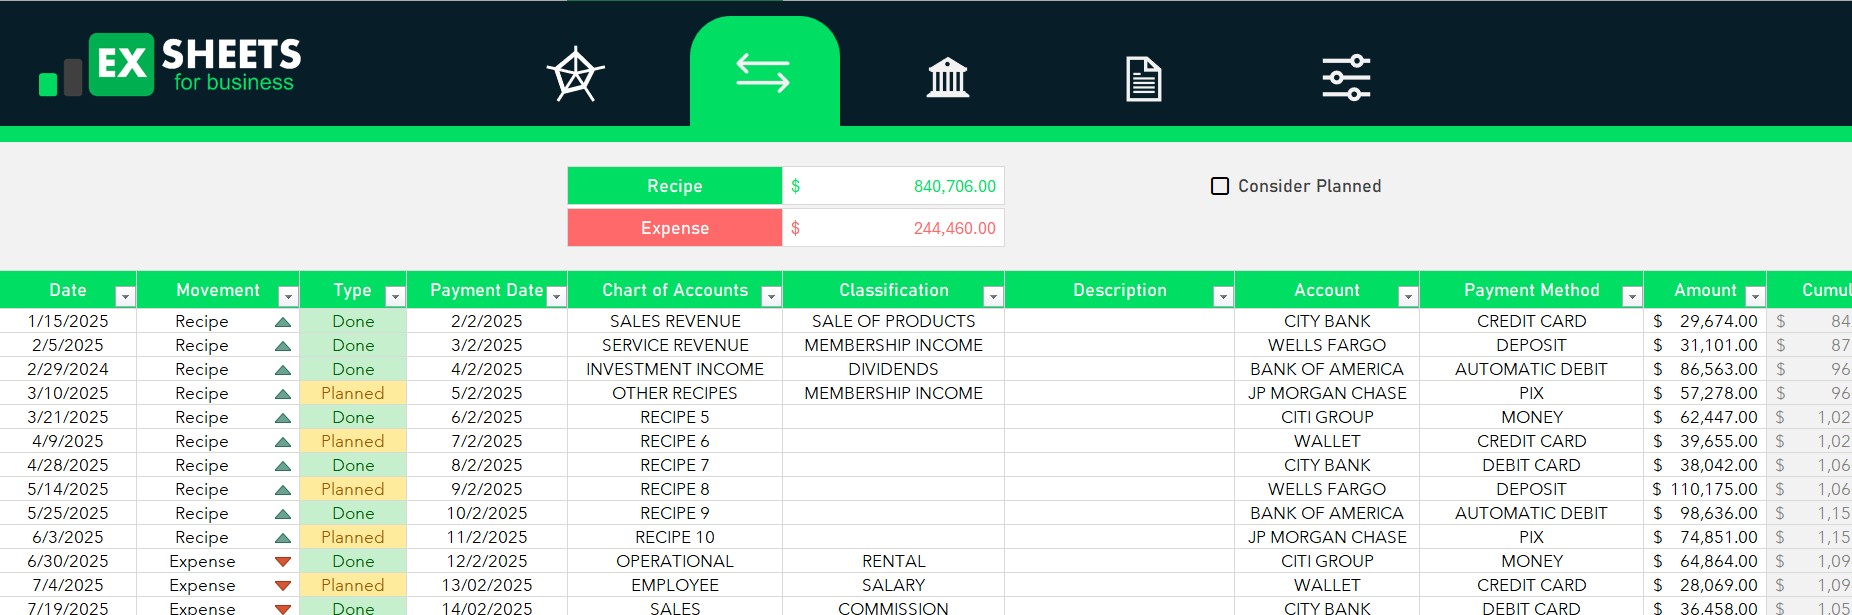
Dynamic Cash Flow Statements
- Tracks operating, investing, and financing activities in real-time.
- Clearly categorizes cash inflows and outflows for better financial oversight.
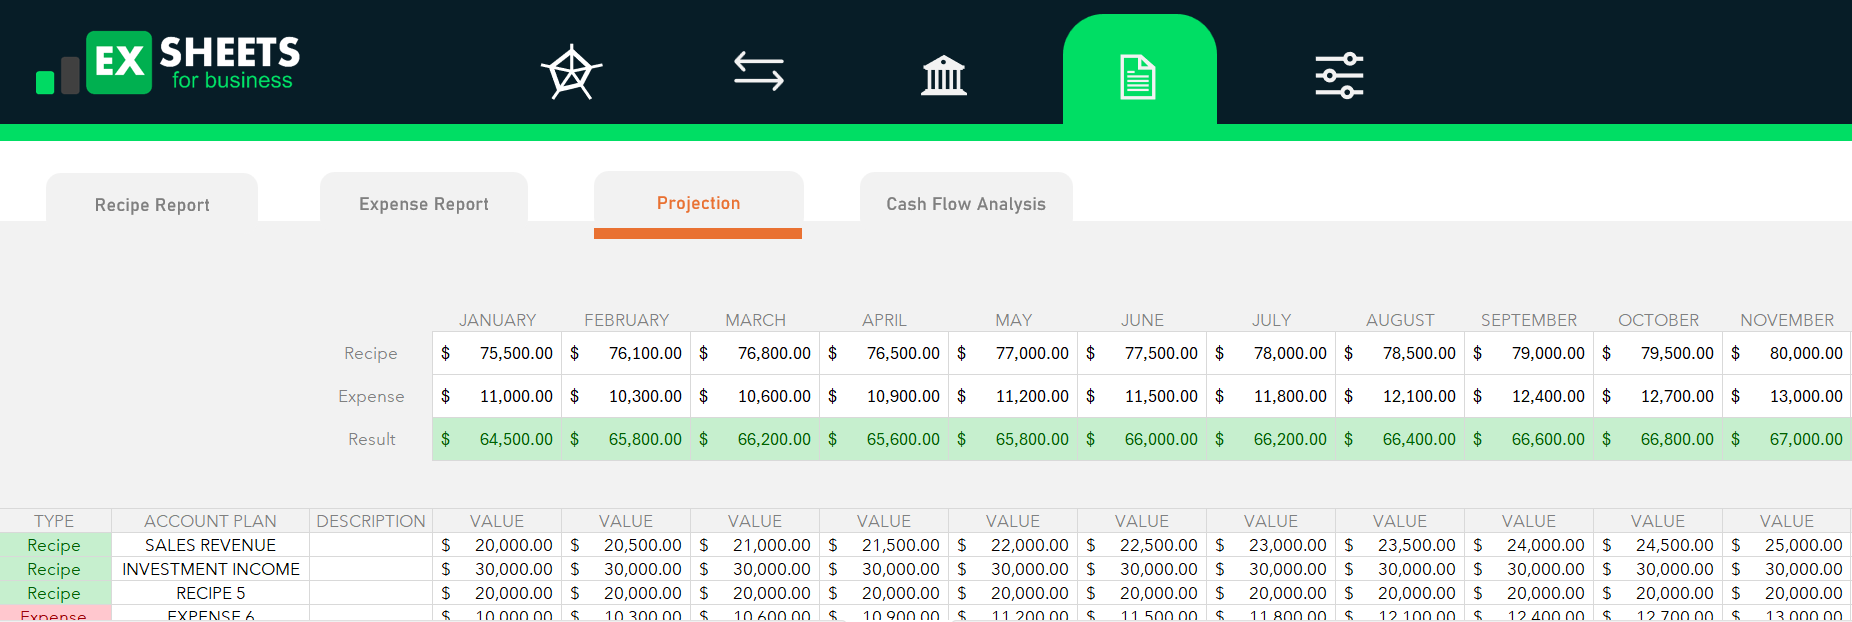
Forecasting & Scenario Analysis
- Generates financial projections based on past trends.
- Allows scenario modeling to compare best, moderate, and worst-case financial situations.
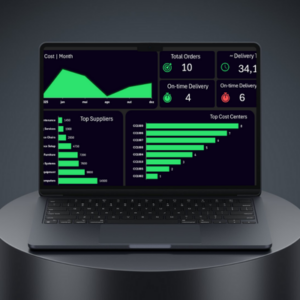
Graphical Representation
- Provides interactive dashboards that visually illustrate financial trends.
- Uses color-coded indicators to highlight key financial health metrics.
How to Use the Spreadsheet
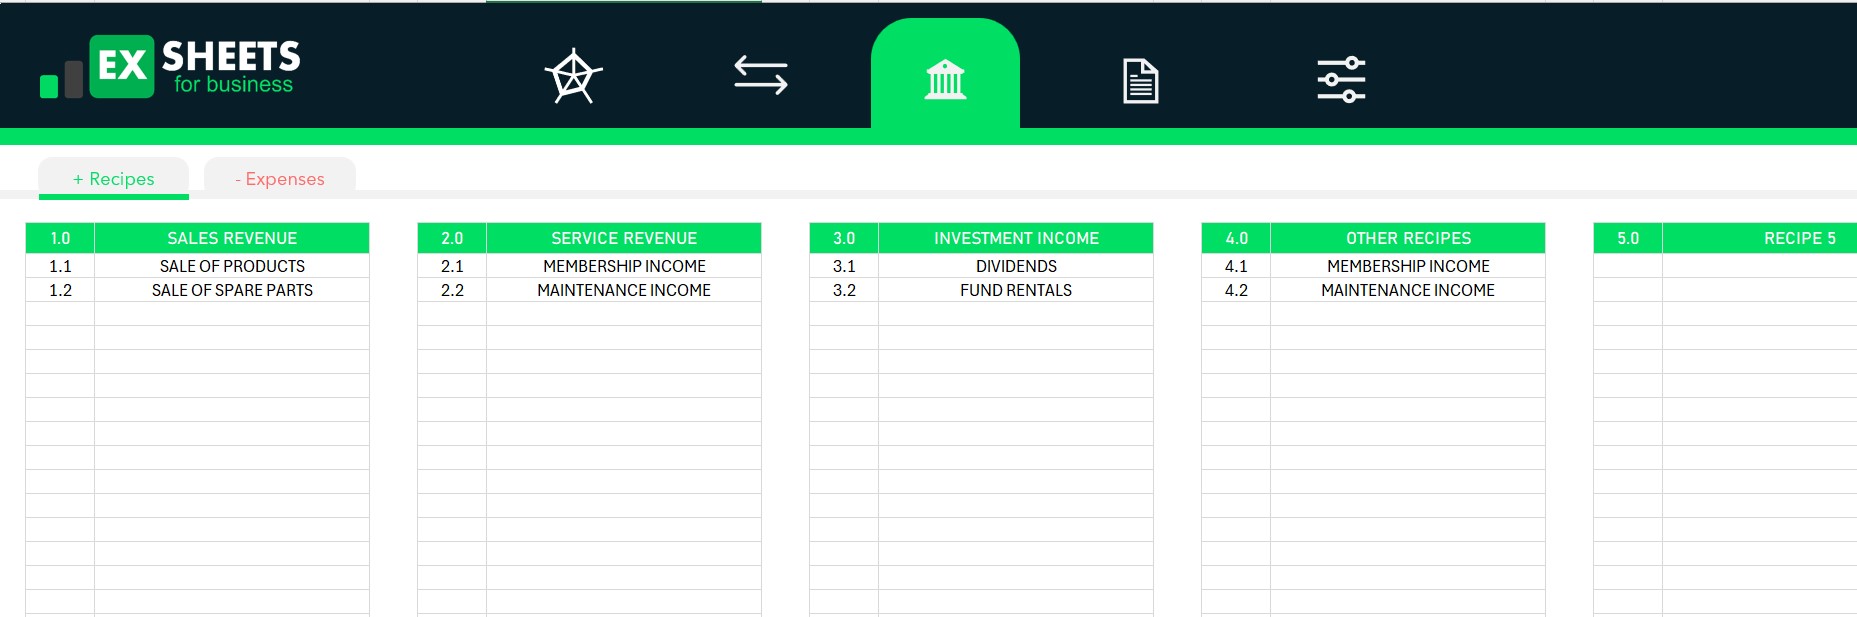
Step 1: Input Financial Data
Start by entering all revenue streams, expenses, and investments. To further simplify data management, link external accounts for automatic updates and real-time accuracy.
Step 2: Analyze Cash Flow Statements
Once the data is in place, review categorized cash flow summaries. Identify patterns, detect trends, and recognize potential liquidity risks that might require adjustments.
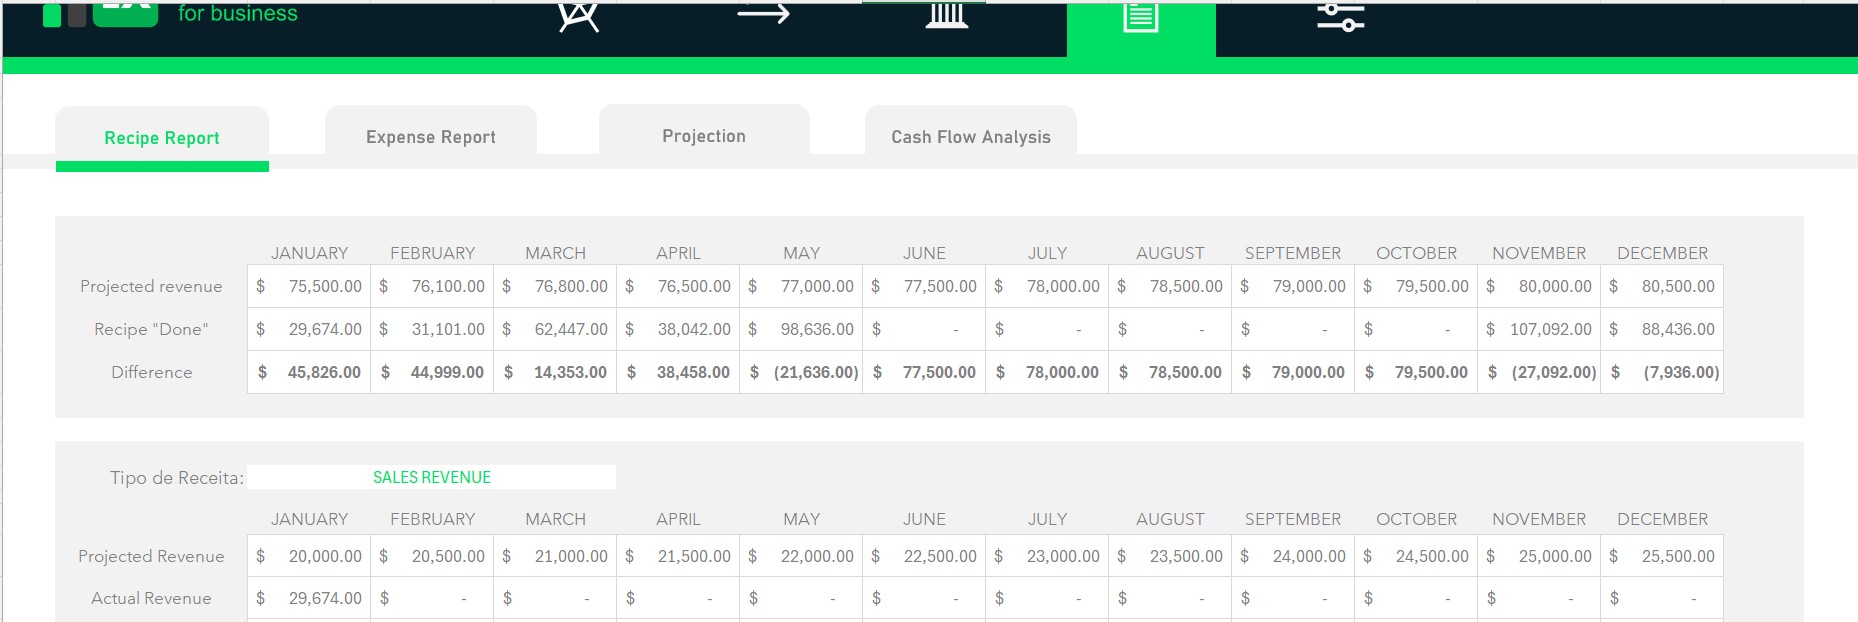
Step 3: Generate Reports & Forecasts
Customize financial reports based on specific time frames—whether monthly, quarterly, or annually. Utilize built-in forecasting tools to predict potential cash flow gaps and adjust accordingly.
Step 4: Optimize Business Decisions
With insights drawn from the analysis, fine-tune spending strategies to maximize efficiency. Make informed decisions on future investments, debt repayments, and other financial obligations to maintain business stability and growth.
Conclusion
Using a paid Excel spreadsheet for financial cash flow analysis simplifies and enhances financial management. With automation, real-time tracking, and fully customizable reporting features, businesses gain a strategic advantage by making data-driven decisions. Investing in a professional tool ensures greater accuracy, improved efficiency, and long-term financial success.


Reviews
There are no reviews yet.