Variance Analysis Excel Templates
Variance analysis refers to the comparison of the forecast to the actuals during a given period. It is imperative for businesses of all scales and structures to measure whether the variance is favorable or unfavorable. Therefore, the numbers and the charts readily available help to make accurate and timely decisions and stay ahead of the curve. Unfortunately, despite the unrivaled significance of variance analysis, most companies tend to use it for limited durations or perform the calculation during the eleventh hour. The culmination is that treasurers take reactive decisions instead of proactive ones. However, your organization does not have to suffer from such an anomaly, as we are here to extend you a helping hand. We offer pre-formulated variance analysis excel templates so that you can easily track your entrepreneurial performance against the pre-determinate goals.
Importance of Variance Analysis Excel Templates for your bussiness
Every business needs an accounts receivable excel template, irrespective of its size. Hence, it goes without saying that variance analysis is a crucial part of accounting, wherein we can compare planned and actual numbers. In simple words, variance analysis is used to trace the performance, under-performance, or over-performance over a timeframe. Although there are a plethora of templates that are downloadable online, we have recognized that they are fundamental and rudimentary.
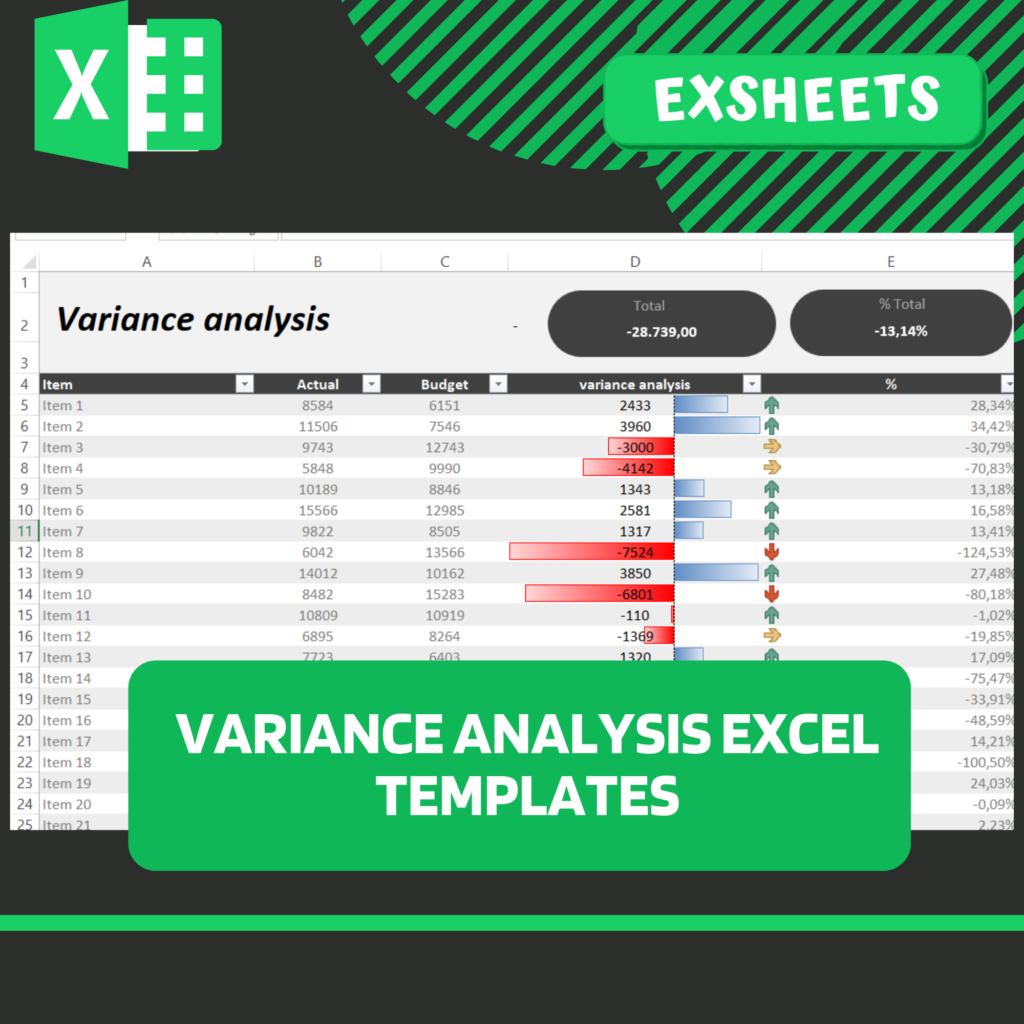
- The distinguishing feature of our variance analysis template is that it is specifically crafted to accommodate large data sets and tell a story via visuals.
- Our templates are user-friendly and beginner-friendly. Thus, you do not have to be an accounting pioneer to use the pre-moderated Excel templates effectively.
- The Summary feature of our variance analysis excel template automatically populates your data and transforms it into bar graphs. Likewise, the drop-down menus make viewing the variance by months and years easy.
- Our template’s monthly evolution sheet also plots 12-months of data into a chart for seamless visualization of the budgeted versus actual performance over a year.
- Our variance analysis Excel templates are compatible with Google Sheets, and you can collaborate with your team and enjoy features such as cloud auto-save and much more.
Thus, our variance analysis template will help you identify and share performance trends with your team. In addition, the flexibility in terms of audit seasonality, product alterations, growth, etc., further elevates your experience.
How to use our Variance Analysis Excel Templates
Skyrocket your business’s performance using one of our best-selling accounts receiveable excel templates. Besides being infused with features, our variance analysis templates are straightforward to use. All you have to do is:
- Enter the data for your forecasts and actuals for different quarters
- The template will automatically calculate the variance in your total cash inflows and outflows.
- You, then, have to determine the variance for categories such as payroll, investment, taxes, and likewise.
- Lastly, you can refer to the bars and graphs for a visual understanding of the variance.
So, do not wait any further and take advantage of our excel sheet templates now.