
Description
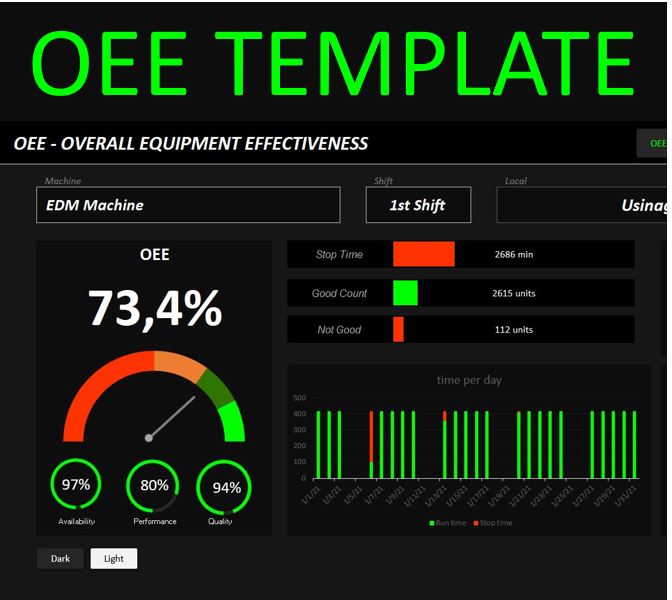
Excel OEE Spreadsheet Template
OEE (Overall Equipment Effectiveness) is a method for measuring manufacturing productivity that is being widely used in the manufacturing industry.
Excel OEE spreadsheet templates will make measuring productivity easier; the user simply fills in the data and the spreadsheet calculates the OEE.
This spreadsheet is calculated from actual equipment availability, performance, and quality losses relative to maximum expected performance.
- Availability (%) = Operating Time / Available Time
- Performance (%) = Total Production / Target Production
- Quality (%) = Good Production / Total Production
Instructions for use:
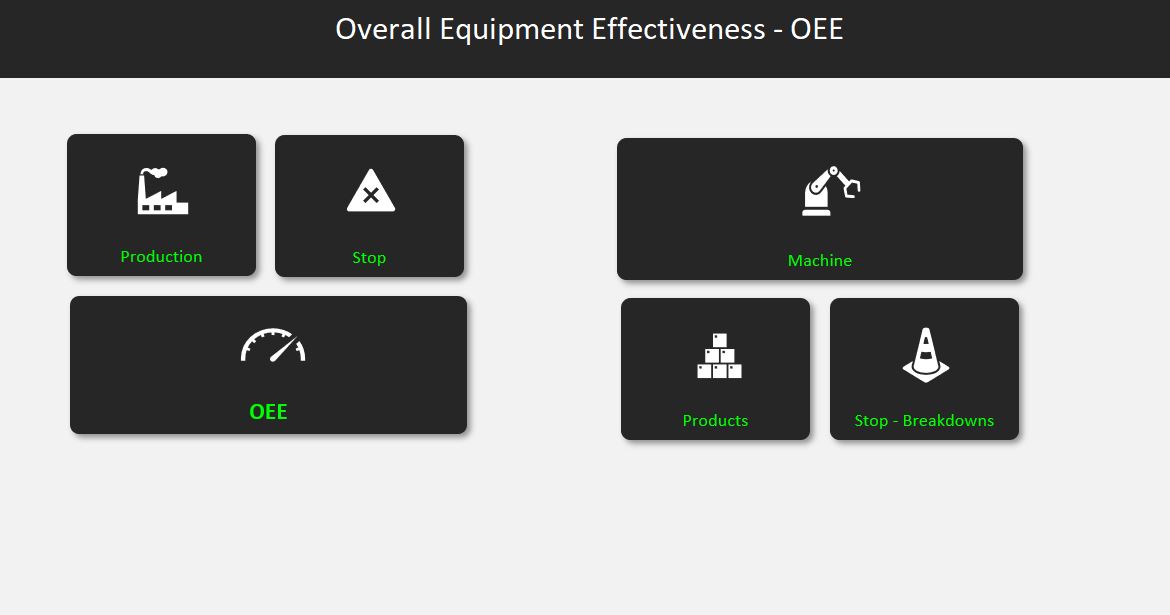
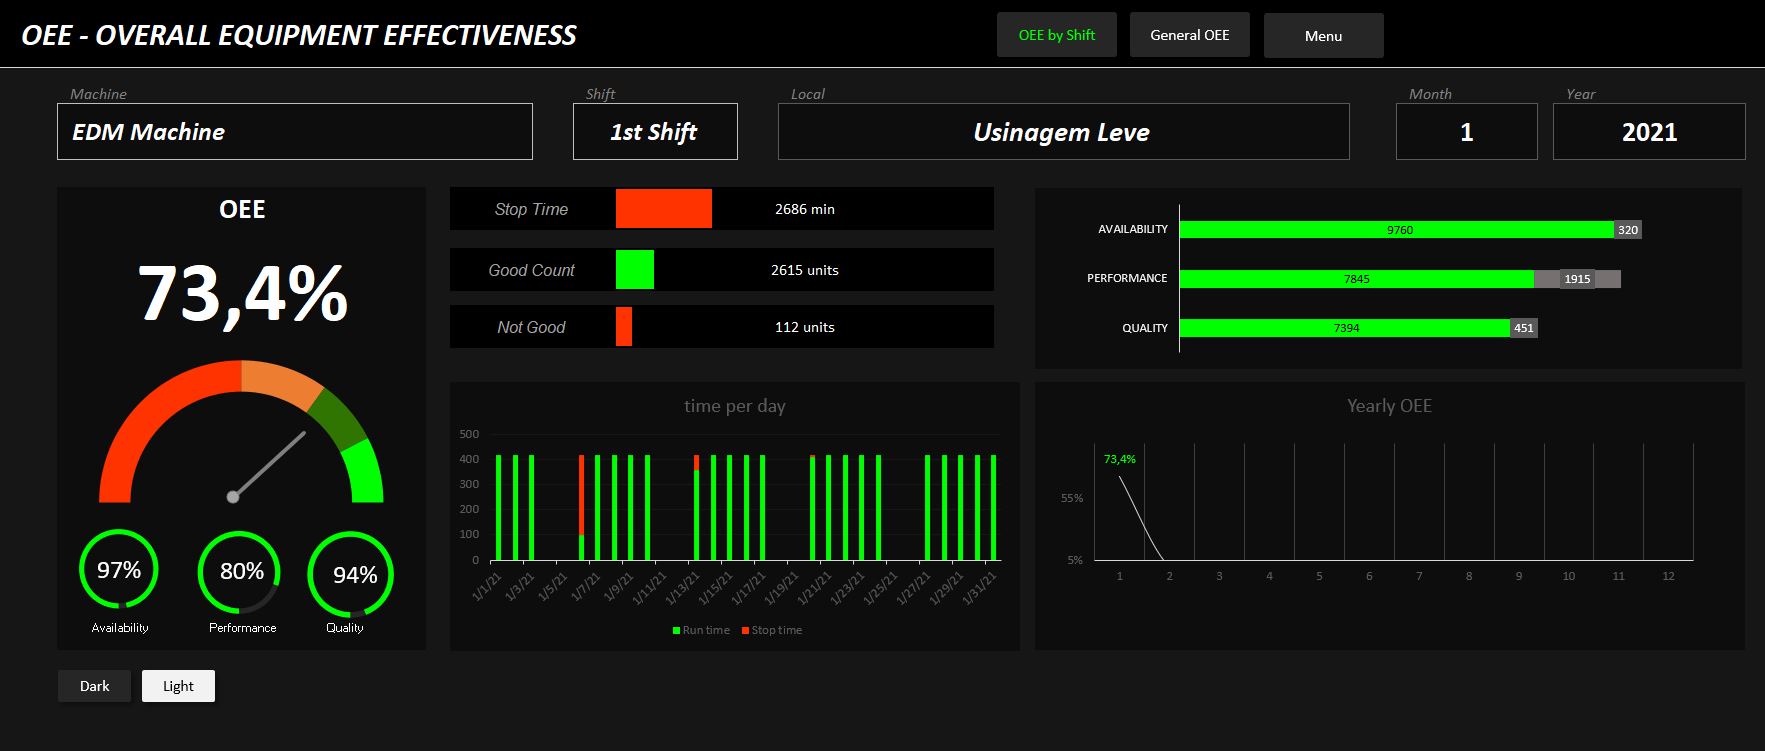
On the initial screen we can see all of the elements for the OEE calculation.
On the right side, you input your Machines, Products, and types of Stops.
On the left side, you enter actual production data and stops and finally, view the OEE dashboard.
First, we’ll fill in the operating system data on the right side:
– On the Products tab, you will enter the id, product description, and cycle time per part (in minutes).
– On the Stop tab, you will enter the type of stop and a description.
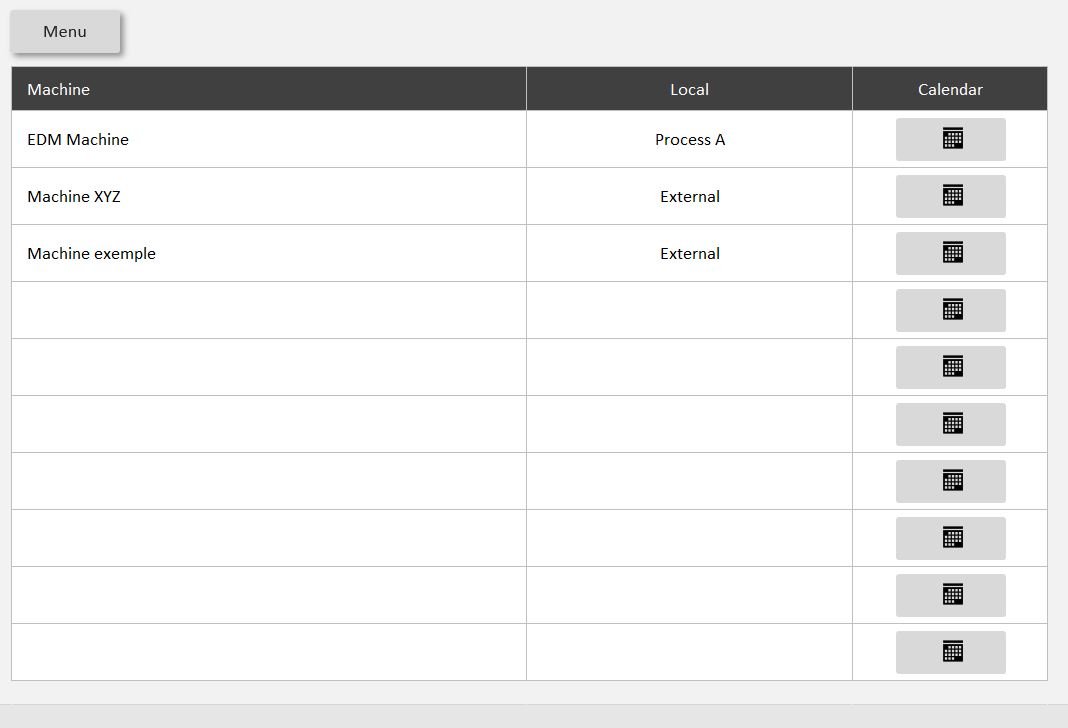
– On the Machine tab you have the option of working with up to 10 machines. For each machine it is necessary to define the annual calendar, and enter the number of times (in minutes) for each day and shift.
Now you have completed the operating data.
To complete the stops, on the left side, navigate to the “stop” tab.
In this table enter the stop and the time (in minutes). You can do this manually or by using the form.
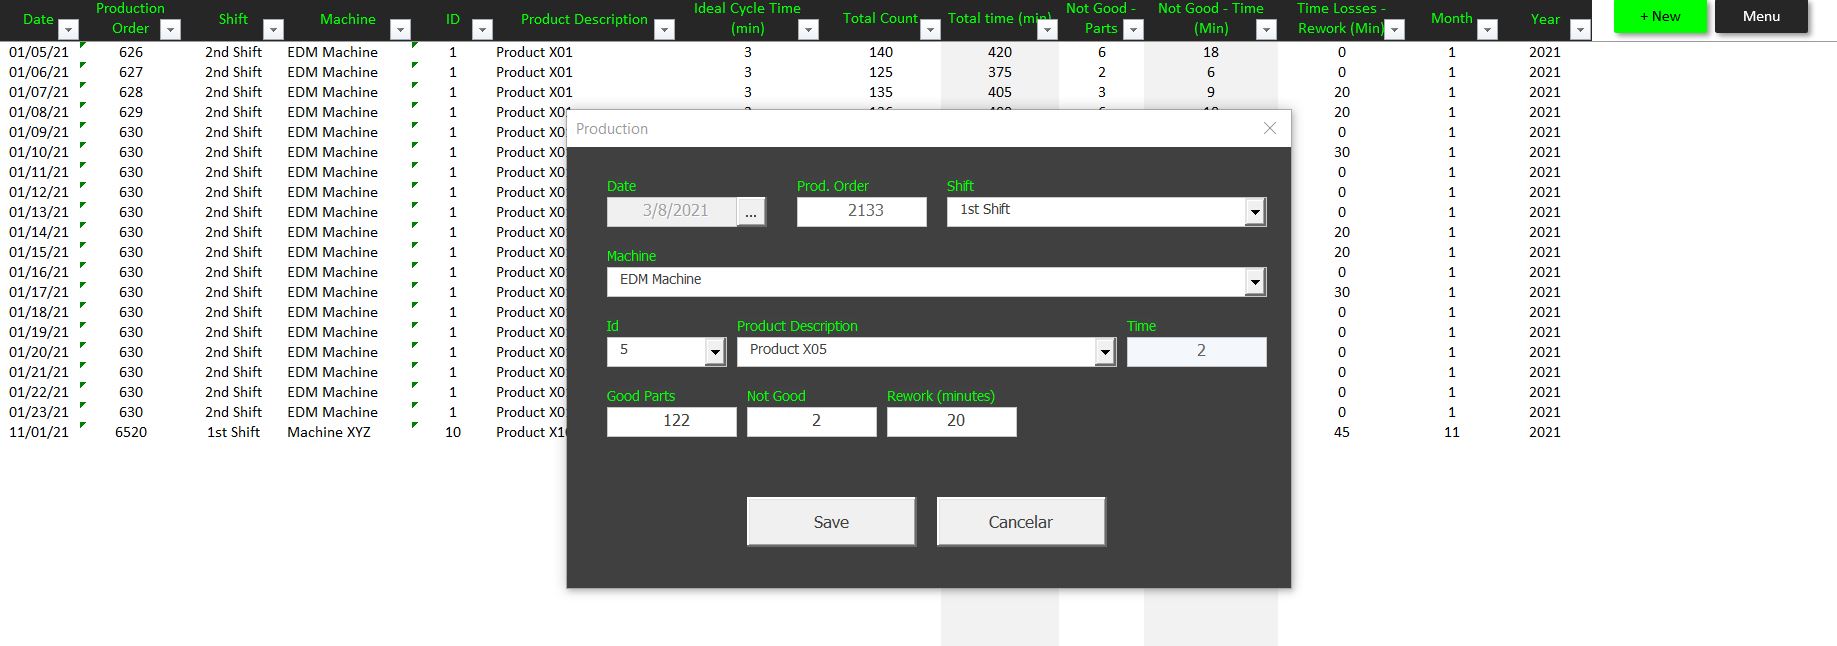
The “production” tab contains data regarding the equipment and the product, count of good parts, not good and in case of loss due to rework, number of minutes.
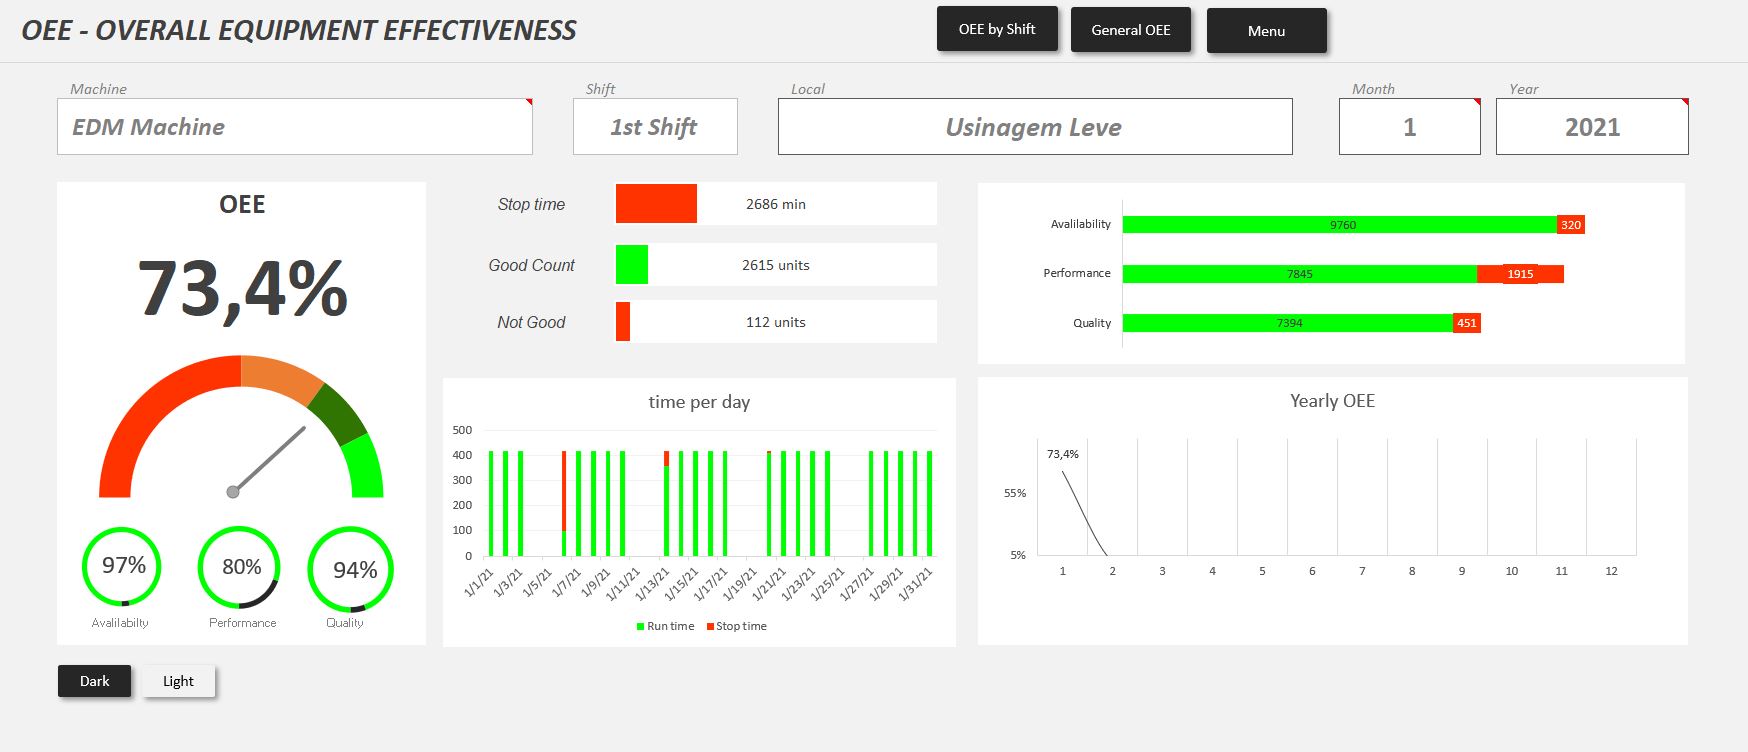
Once the data is filled in, the spreadsheet will calculate the OEE. In the OEE dashboard we can see the result of availability, performance, quality and more.
Additional features of this dashboard include:
– Advanced filtering by month, machines, and shifts
– Results by shift or overall
– and Light and Dark color settings
These files can be used as is and can be modified BY USER to suit many different manufacturing processes.


Smart –
Hello Renny. We already sent your spreadsheet. Please, check your spam and inbox.