

Description
NPS Graph Excel template is a Net Promoter Score excel that will help calculate and measure your customer loyalty. It boosts your business and guides you in planning different strategies.
It is a loyalty measurement where customers answer the question – On a scale from 0 to 10, how likely are you to recommend this product/brand? You can survey such questions and calculate the response. However, it is not easy to do the calculation.
For this very purpose, using a graph in excel can help you do better calculations. In addition, it will help you gauge customer satisfaction accurately.
Why do you need a Net Promoter Score?
Net Promoter Score (NPS) functions as a tool for businesses to gauge customer loyalty and satisfaction. Based on this, your business can strategize and improve your services ranging from product quality to delivery and customer support.
Calculating the score and tracking enthusiastic customers go a long way in enhancing your business over time. So it is a very valuable and viable metric that paints a clear picture. But more than that, it helps businesses do other things like knowing the reasons for consumers’ satisfactory level, tracking the scores and determining benchmarks to achieve, and fixing goals and aims to achieve.
Why do you need to calculate?
When you send out surveys and record the feedback, it is helpful for the brand. However, even if you collect 1000s of responses, it will be of no use if you don’t analyze the responses.
While the first five responses you see give negative reviews, the next ten might give the highest response score. So it is necessary to find a middle ground and arrive at an average.
This can be achieved by using the Net Promoter Score. It will calculate the responses using the fundamental operations of addition and subtraction and arrive at a result that will determine where you actually stand.
How to calculate the Net Promoter Score?
The Net Promoter Score (NPS) is calculated by subtracting the percentage of customers/clients who wouldn’t recommend your product from the percentage of individuals who will recommend this product.
Formula: Net Promoter Score = % of Promoters – % of Detractors
So how do you define the Promoters and Detractors?
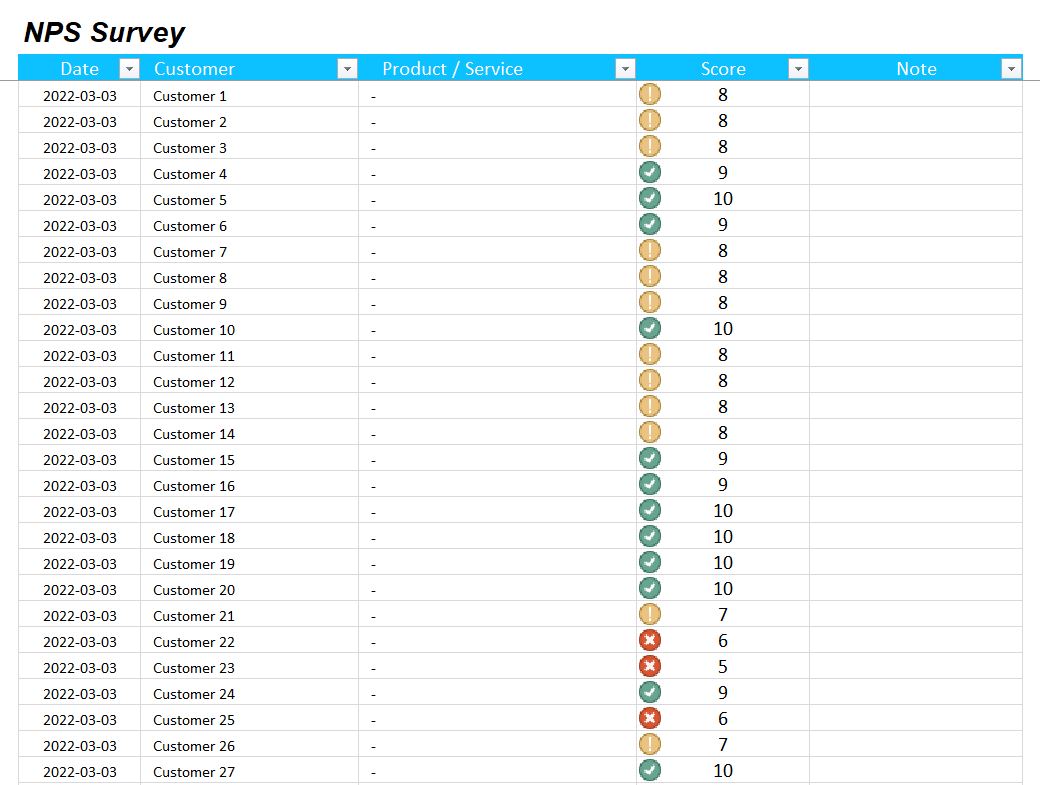
As we said earlier, individuals respond on a scale from 0 to 9/10. So based on the responses you get, you can determine the different respondents.
- Promoters – Responses of 9 or 10
- Passives – Responses of 7 or 8
- Detractors – Responses of 0 to 6
Download NPS Graph Excel Template Today!
NPS will help grow and develop your business. It is a critical metric that will help you know your customers and evolve accordingly. However, measuring NPS could be pretty complicated.
The problem could be solved by using excel to do the calculations. But again, how to do the calculation in excel is another major issue.
Putting an end card to all such worries, Exsheets provides you with an NPS Graph Excel Template at a very affordable price.
What are you waiting for? Grab your NPS Graph Excel Template Now!


vorbelutrioperbir –
I couldn’t resist commenting
Rana Raynes –
he blog was how do i say it… relevant, finally something that helped me. Thanks